|
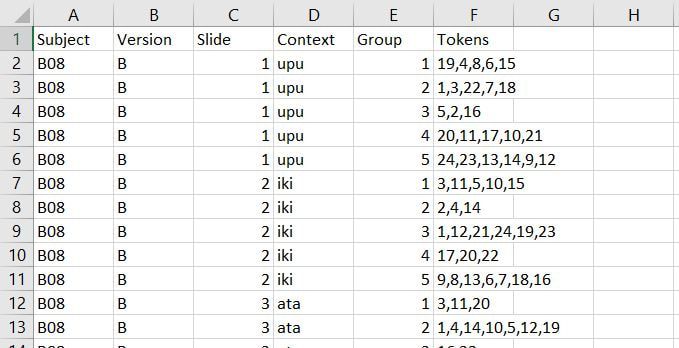
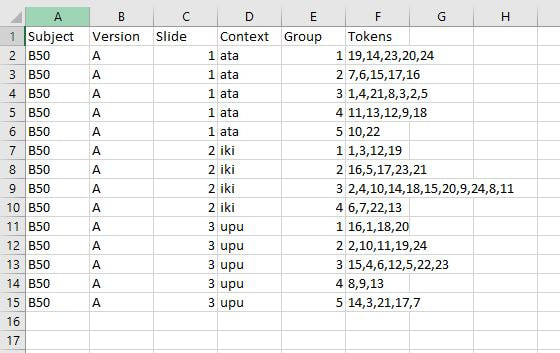
Once you have results for your free classification task, you'll need to code what stimuli participants grouped together. We recommend having around 30 participants or more for your eventual analysis. If you use the format pictured below, you will then be able to use an R script that creates similarity matrices from your data. Make sure you label your columns this way so that the R script will work correctly. Subject: The participant's ID Version: The version of the task that the participant did
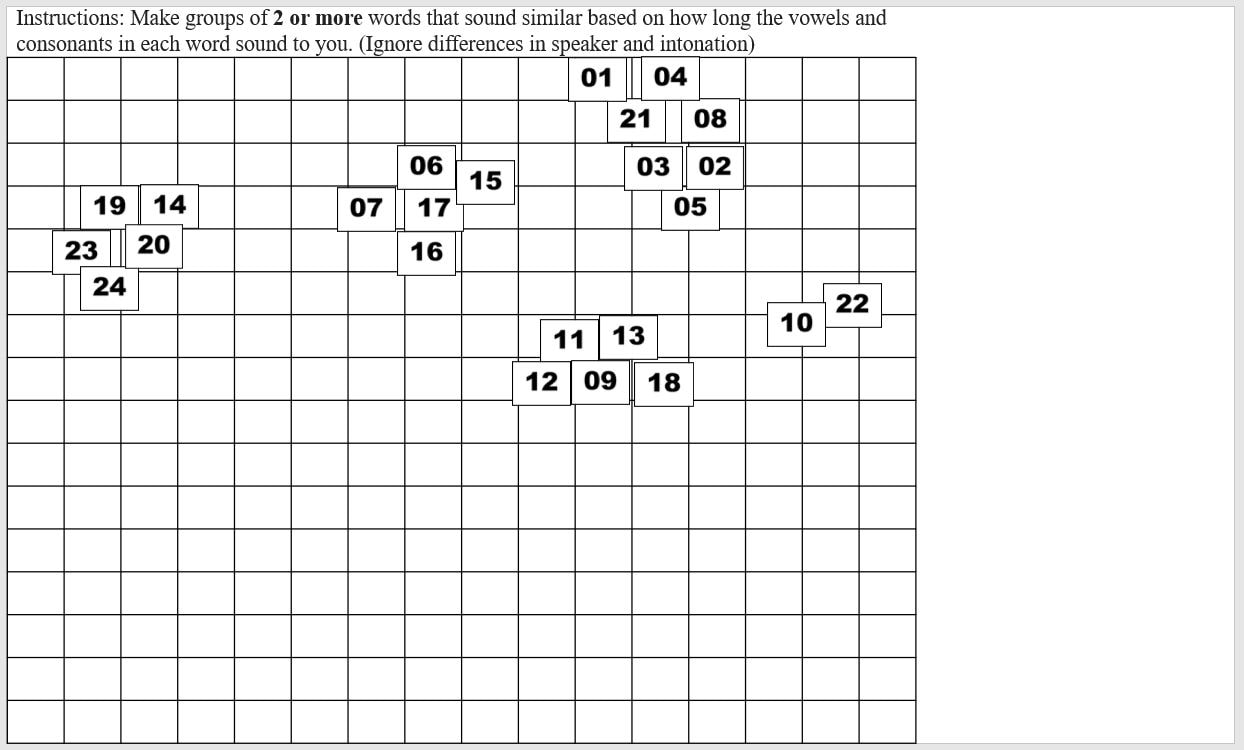
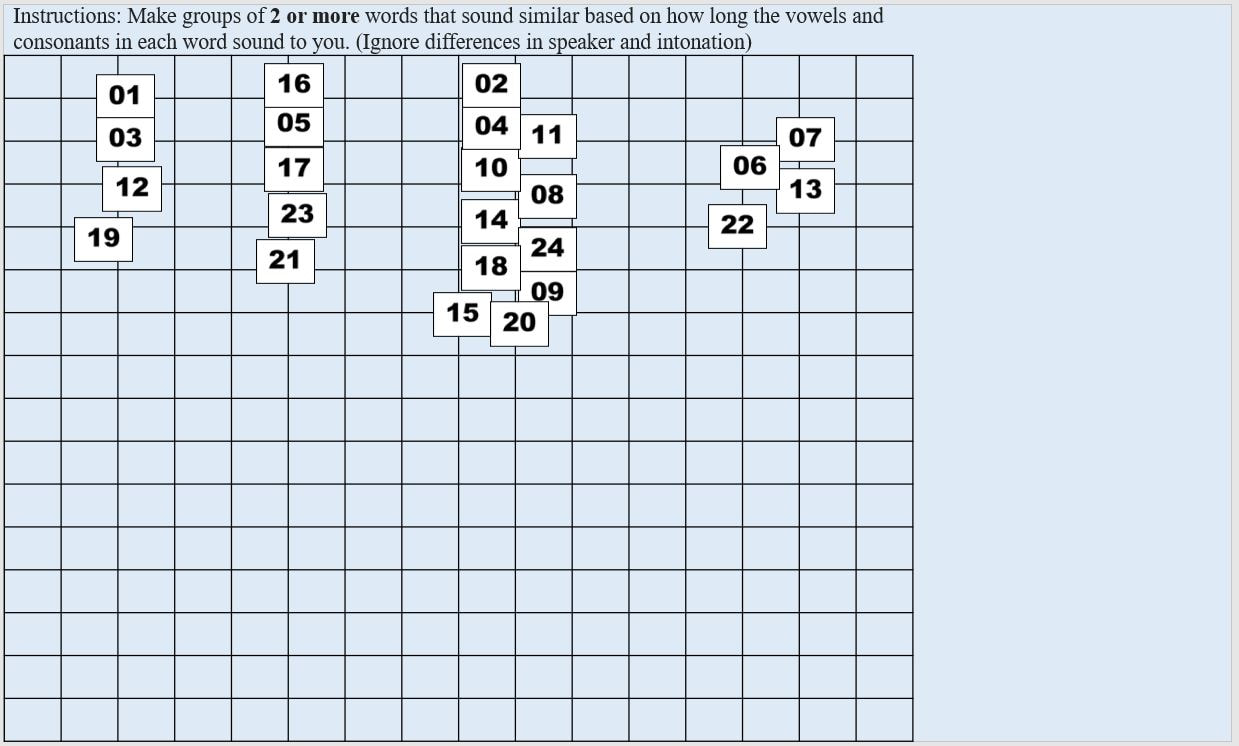
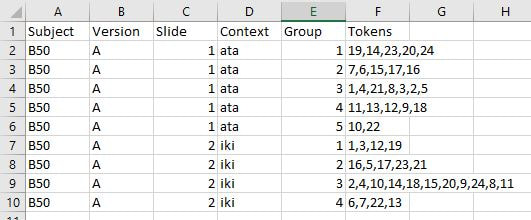
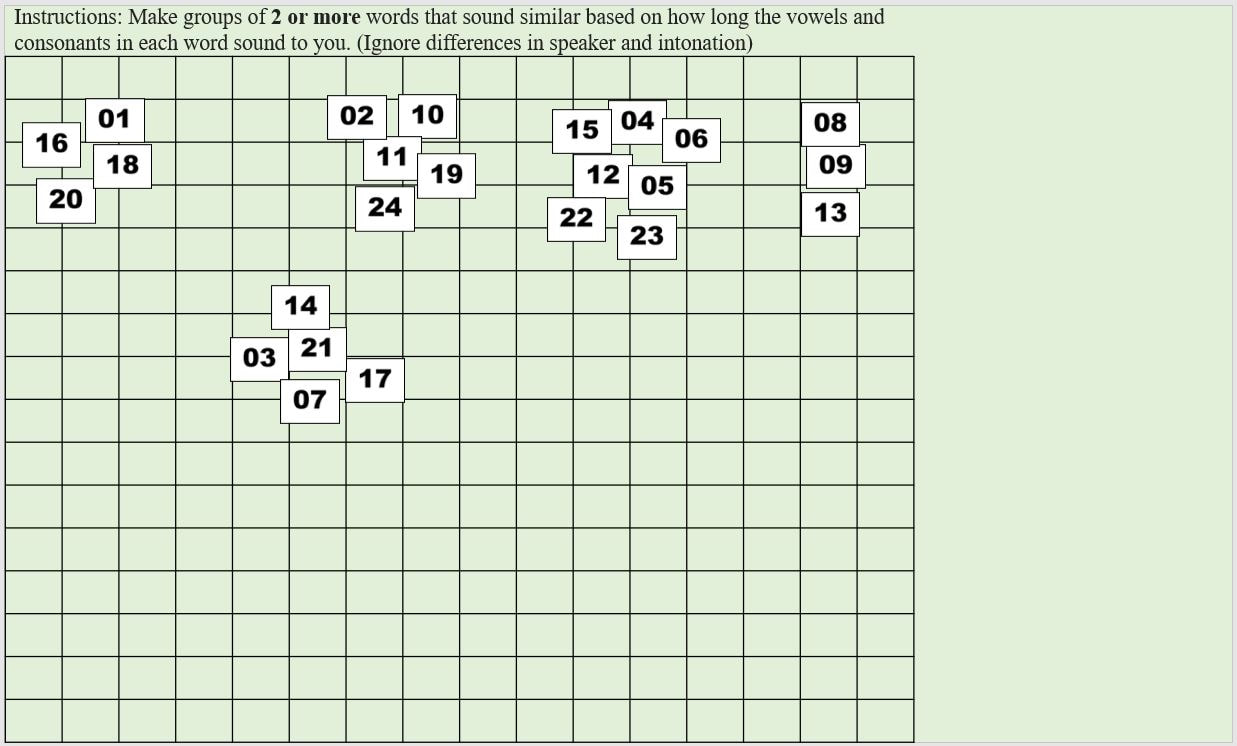
Context: The context for that slide Group: Which group on that slide you are coding Tokens: Which tokens were grouped together in that group Let's use the following participant's results as a model. Here is their first slide: This participant's ID is B50. They did version A of our task. This is slide 1, and in Version A, the context on the first slide is "ata". They made 5 groups of stimuli on this slide, so let's choose a group at random and code it, for instance the group at the left containing 19, 14, 23, 20, and 24. Since this is the first group we're coding on this slide, we can label it group 1 under Group and put in the token numbers under Tokens. For the token numbers, we want to separate them with commas and no spaces. It doesn't matter what order the token numbers are in within that cell. So now we have: If we code the rest of the groups on this slide, we have: Here is B50's second slide: And below is the coding for this slide added to the spreadsheet. Since B50 made 4 groups on this slide, we only have 1-4 under Group: Here is B50's slide 3: And the coding for this slide added to the spreadsheet: This participant's results are finished being coded! Do this for all your participants and you'll be ready to analyze your data. You'll need to save this spreadsheet as a tab-separated text file for use with the R script to create similarity matrices.
0 Comments
Leave a Reply. |
AuthorI like sounds. Here I'll teach you how to play with them and force other people to listen to them. For science. Archives
August 2023
Categories |


 RSS Feed