Analyzing free classification results: Using an R script to obtain (dis)similarity matrices2/11/2023 To analyze your data with the R script below, you'll need 2 files:
The R code will create various similarity and dissimilarity matrices (by counts, by percentages, by contexts individually and combined, etc.) that can be used to visualize your results and analyze them with multi-dimensional scaling. These will be saved to your working directory as text files with the name as specified in each code block. Note that when you open these files, the headers will be one column off, since they'll start at the very left. Let's look at one file as an example. Below we have a screenshot of the tab-separated text file for similarity in percentages for Context 1 (in this case "upu") with all speakers combined. 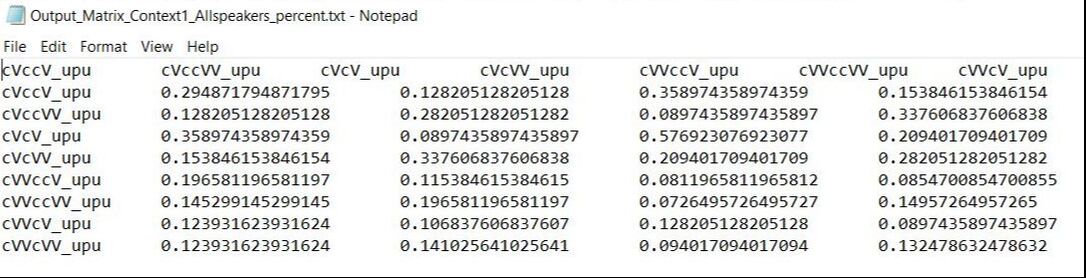 As you can see, the header cVccV_upu at the top left should be the header for the first column of numbers. If you want to make a table with these results, I recommend opening this file in Excel and moving all of the headers one column to the right. (Note that you do NOT need to do this to use the R script for multi-dimensional scaling described in the following blog post.) The file will now look like this: 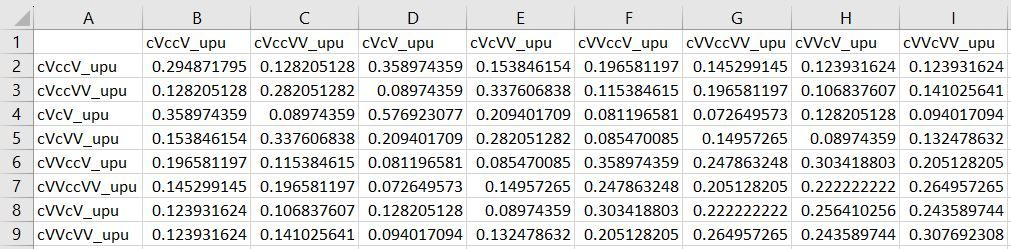 This file shows us that, for example, [kuppu] tokens and [kuuppu] tokens were grouped together 19.7% of the time (column B, row 6). Since this is the similarities for all speakers combined, the numbers along the diagonal show how often the sound files of the same stimulus spoken by different speakers were grouped together (not very often; English speakers are bad at length).
The R code can handle up to 4 different contexts. If you have more than 4 contexts, have more than 2 versions (i.e. Version A and Version B for counterbalanced order of presentation), or find any errors with the code, let me know at daidoned AT uncw.edu and I can modify/fix the script.
0 Comments
Leave a Reply. |
AuthorI like sounds. Here I'll teach you how to play with them and force other people to listen to them. For science. Archives
August 2023
Categories |
 RSS Feed