|
Multi-dimensional scaling (MDS) is a way of determining the placement of each stimulus in space so that the perceptual distances between the stimuli are recreated as closely as possible, with stimuli that were judged to be more similar placed closer together and stimuli judged to be less similar placed further apart. If you're not familiar with MDS, you may find the explanation on pp. 1107-1108 of our 2023 SSLA article on free classification to be useful. You can perform MDS analyses on any of the matrix outputs from the create_FC_similarity_matrices.Rmd file from the previous blog post using this R Markdown file. A pdf example using this script to analyze our Finnish length data can be viewed here. In order to decide the appropriate number of dimensions for your data, it's a trade-off between minimizing model misfit (stress) and maximizing the amount of variation explained (R-squared, "R2"), as well the interpretability of the solution. As we say in our SSLA article (pp. 1112-1113): Because higher stress in MDS indicates greater model misfit, Clopper (2008, p. 578) recommends looking for the “elbow” in the stress plot to find the number of dimensions beyond which stress does not considerably decrease, whereas Fox et al. (1995, p. 2544) recommend looking for the number of dimensions beyond which does not considerably increase, provided that this number of dimensions is interpretable based on the relevant theory. Clopper (2008) also states that a stress value of less than 0.1 for the matrix is considered evidence of “good fit,” although she acknowledges that this is rarely achieved in speech perception data. Unfortunately the R package for MDS that I used in the R Markdown file doesn't give R2 values (if this is important, you can obtain these with an MDS analysis in SPSS); however, we can look at the stress amounts and the plot produced by the script. In the stress plot for our Finnish length data, there is no clear elbow in the plot, but rather a gradual decrease in model misfit. We decided on a 3D solution, but a 2D solution would also be appropriate. A 1D solution has clearly too much stress, while a 4D or 5D solution would be very difficult to interpret and visualize. 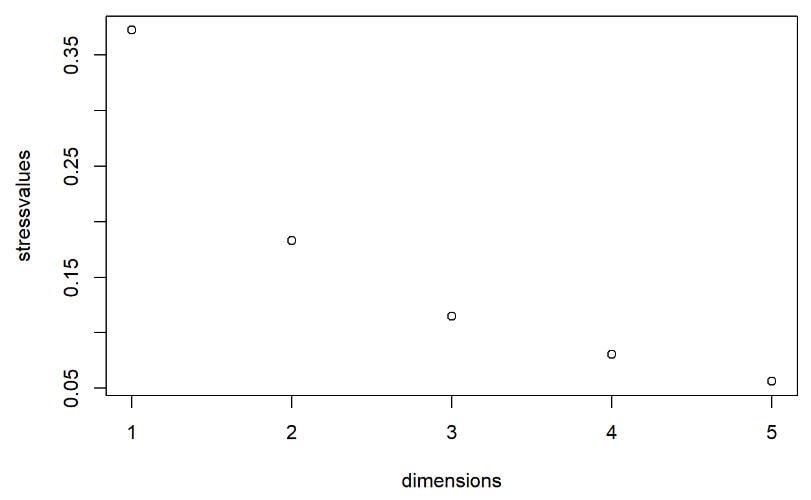 This script will save text files of the dimension scores for 1, 2, 3, 4, and 5 dimensional solutions. The dimension scores are the points in space of each stimulus. In the image below, we see the 3 dimensional solution of our Finnish length data, combined across contexts. You can think of D1, D2, and D3 as (x, y, z) coordinates. For example, in row 7, we see that the average CVCCVV token for speaker N (averaged across pata, tiki, and kupu contexts) is placed by the MDS solution at x = 0.00527, y = -0.59382, z = -0.41867. 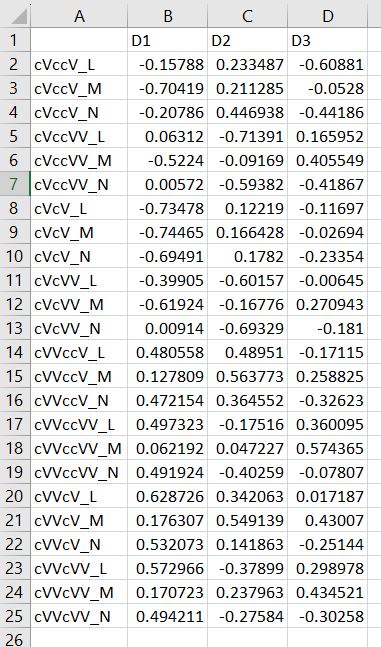 When Dimension 1 x Dimension 2 (i.e. x and y coordinates) and Dimension 1 x Dimension 3 (i.e. x and z coordinates) are plotted , we see where CVCCVV_N is placed relative to other stimuli. You can think of the second graph (Dim1 x Dim3) as viewing the first graph from above. 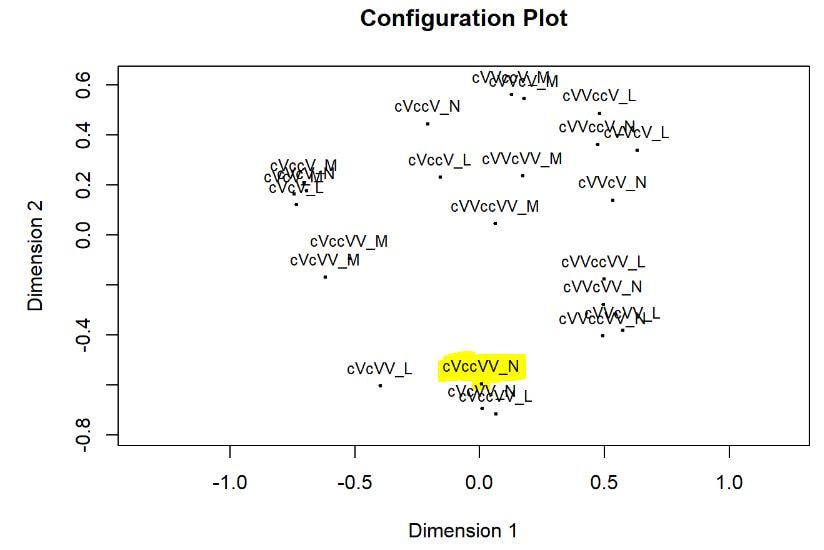 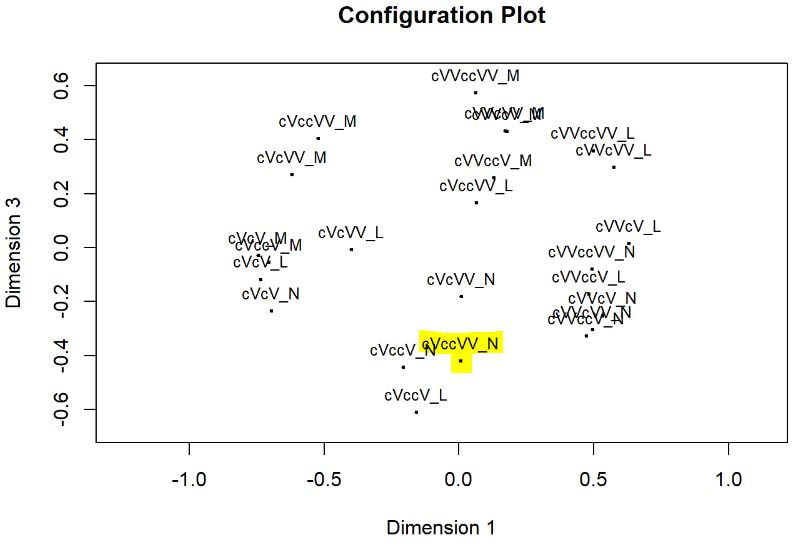 In these plots, you can somewhat see that the stimuli are grouping together mainly by vowel length rather than consonant length (e.g. Dim 1 has mostly short V1 on the left and long V1 on the right), but it's still difficult to interpret. For this reason, we recommend rotating the solution (i.e. moving all of the points in a certain way by a specific amount) to provide a better visualization. This doesn't change the position of the points relative to each other, which is the important part in an MDS solution. My colleague Ryan Lidster did this in Excel, but since that was rather clunky, I'm working with him on creating an R script to aid in rotating MDS solutions and plotting them. Stay tuned!
0 Comments
Analyzing free classification results: Using an R script to obtain (dis)similarity matrices2/11/2023 To analyze your data with the R script below, you'll need 2 files:
The R code will create various similarity and dissimilarity matrices (by counts, by percentages, by contexts individually and combined, etc.) that can be used to visualize your results and analyze them with multi-dimensional scaling. These will be saved to your working directory as text files with the name as specified in each code block. Note that when you open these files, the headers will be one column off, since they'll start at the very left. Let's look at one file as an example. Below we have a screenshot of the tab-separated text file for similarity in percentages for Context 1 (in this case "upu") with all speakers combined. 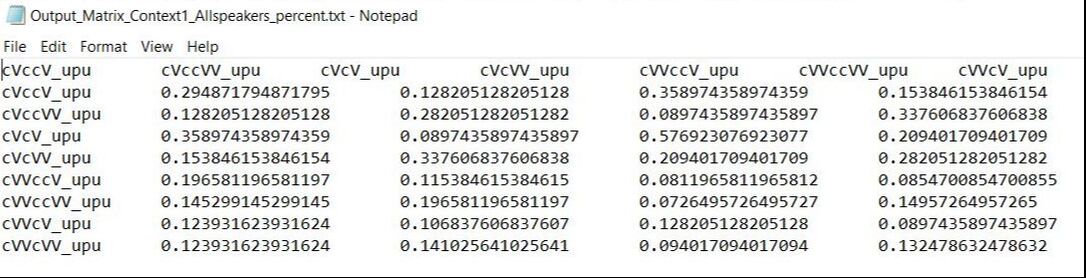 As you can see, the header cVccV_upu at the top left should be the header for the first column of numbers. If you want to make a table with these results, I recommend opening this file in Excel and moving all of the headers one column to the right. (Note that you do NOT need to do this to use the R script for multi-dimensional scaling described in the following blog post.) The file will now look like this: 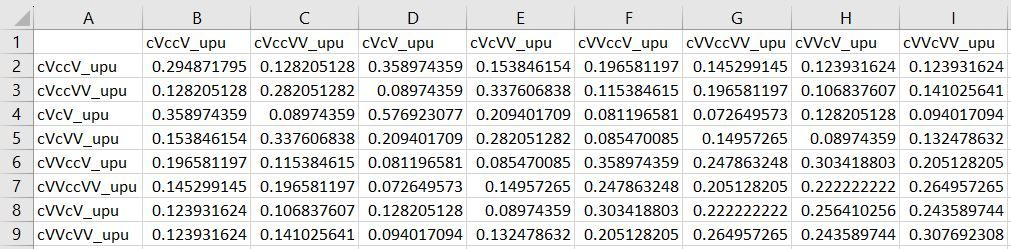 This file shows us that, for example, [kuppu] tokens and [kuuppu] tokens were grouped together 19.7% of the time (column B, row 6). Since this is the similarities for all speakers combined, the numbers along the diagonal show how often the sound files of the same stimulus spoken by different speakers were grouped together (not very often; English speakers are bad at length).
The R code can handle up to 4 different contexts. If you have more than 4 contexts, have more than 2 versions (i.e. Version A and Version B for counterbalanced order of presentation), or find any errors with the code, let me know at daidoned AT uncw.edu and I can modify/fix the script. Once you have results for your free classification task, you'll need to code what stimuli participants grouped together. We recommend having around 30 participants or more for your eventual analysis. If you use the format pictured below, you will then be able to use an R script that creates similarity matrices from your data. 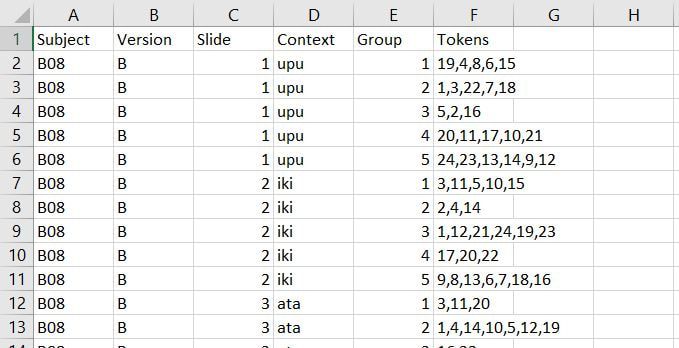 Make sure you label your columns this way so that the R script will work correctly. Subject: The participant's ID Version: The version of the task that the participant did
Context: The context for that slide Group: Which group on that slide you are coding Tokens: Which tokens were grouped together in that group Let's use the following participant's results as a model. Here is their first slide: 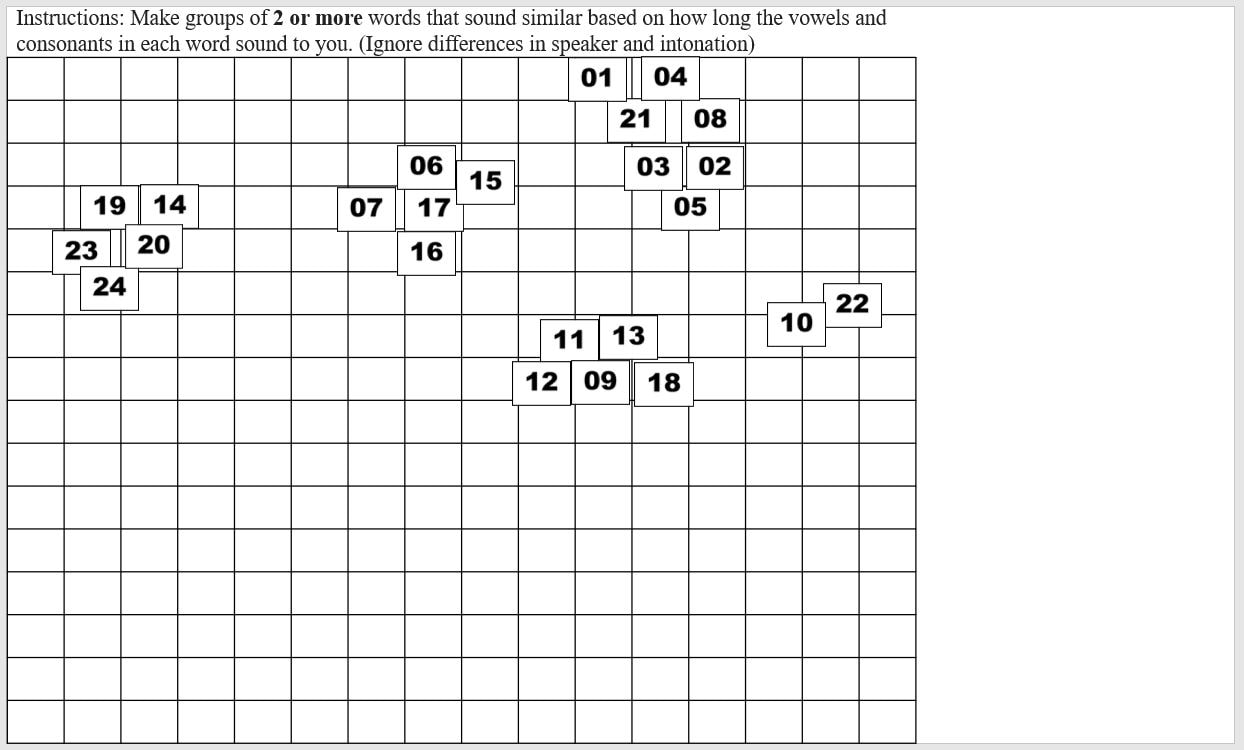 This participant's ID is B50. They did version A of our task. This is slide 1, and in Version A, the context on the first slide is "ata". They made 5 groups of stimuli on this slide, so let's choose a group at random and code it, for instance the group at the left containing 19, 14, 23, 20, and 24. Since this is the first group we're coding on this slide, we can label it group 1 under Group and put in the token numbers under Tokens. For the token numbers, we want to separate them with commas and no spaces. It doesn't matter what order the token numbers are in within that cell. So now we have: 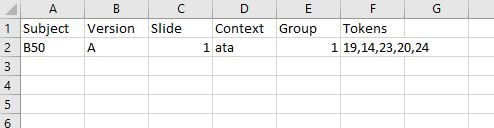 If we code the rest of the groups on this slide, we have: 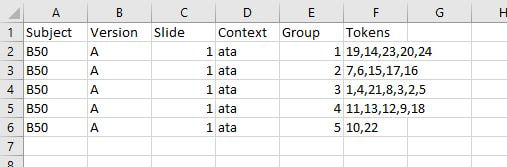 Here is B50's second slide: 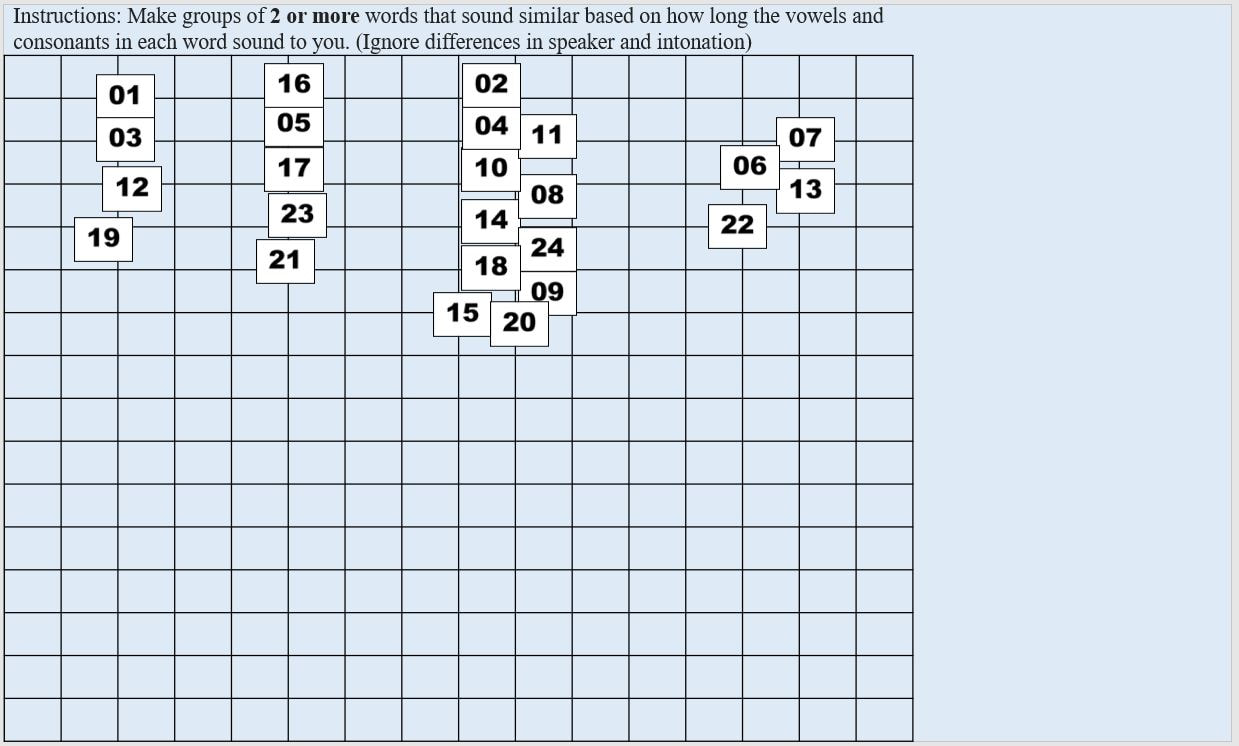 And below is the coding for this slide added to the spreadsheet. Since B50 made 4 groups on this slide, we only have 1-4 under Group: 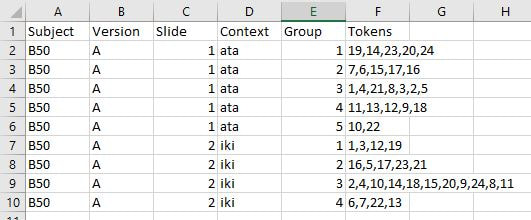 Here is B50's slide 3: 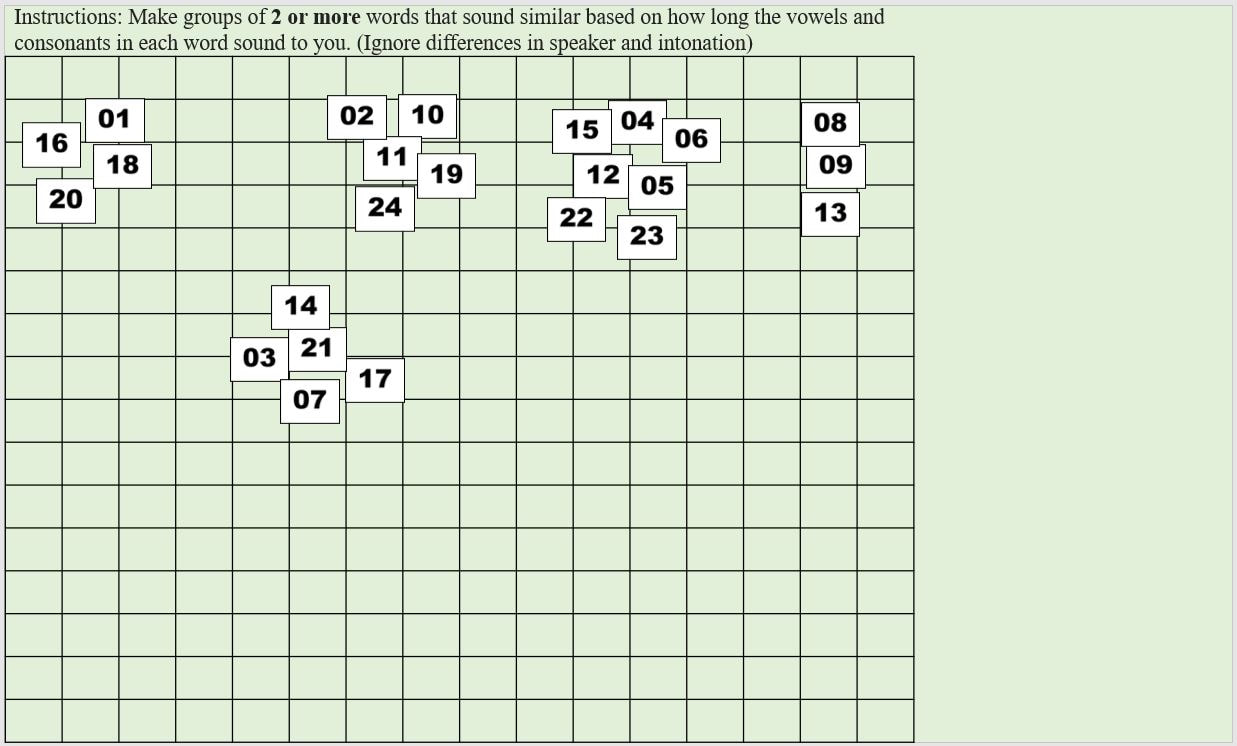 And the coding for this slide added to the spreadsheet: 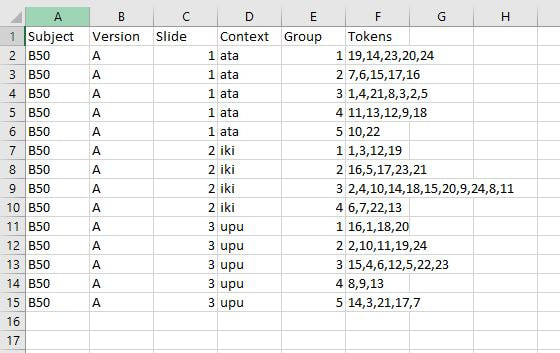 This participant's results are finished being coded! Do this for all your participants and you'll be ready to analyze your data. You'll need to save this spreadsheet as a tab-separated text file for use with the R script to create similarity matrices.
In this post I'll discuss how to create a free classification task, also known as a free sort task, which we apply to non-native perception in Daidone, Kruger, and Lidster (2015). This task is useful for determining the perceptual similarity of non-native sounds and examining what acoustic, phonological, or indexical dimensions of the stimuli matter for listeners. It can be used to examine segmental or suprasegmental phenomena and can be used to predict their discriminability (check out our slides from New Sounds 2019). Here is an example of what our Finnish length free classification task looks like in PowerPoint. The numbers on the slide are sound files that participants click on and listen to and then group by which seem similar to them. 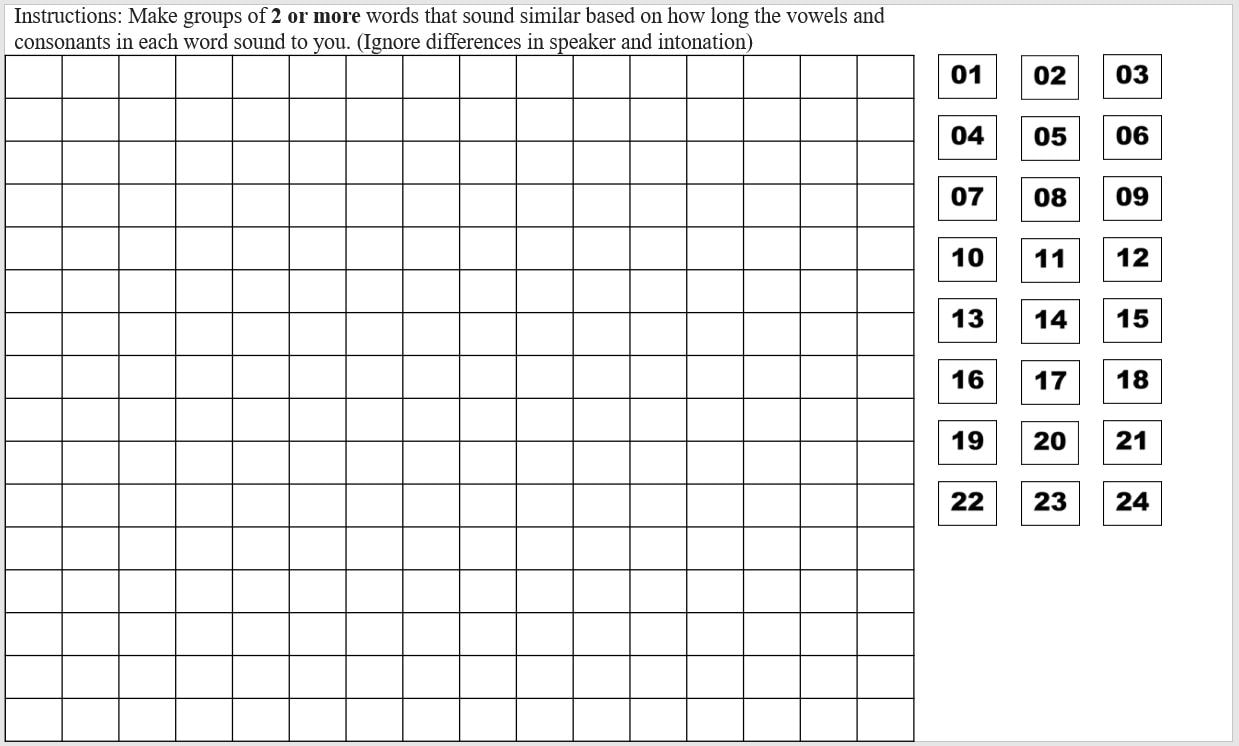 Once you have the sound file containing all of your stimuli, you'll need to segment it into smaller, individual files for each stimulus. You can do this using the free acoustic analysis software Praat, available at praat.org.
Once you open Praat, you'll see that both a "Praat Objects" window and a "Praat Picture" window appear at start up. You won't be using the Praat picture window, so you can close that. Before we begin cutting a sound file, let's just see what sounds look like in Praat. In the top menu, go to "Open" --> "Read from file" and choose your sound file. It should now appear highlighted in the Objects window. Click on "View & Edit" on the right-hand menu to see your sound file: The recording list:
Once you've chosen a perception task, it's time to make stimuli for it.
How many stimuli do I need? The answer to this question isn't simple. You'll need to strike a balance between getting a sufficient amount of data and how long you can reasonably expect people to sit and do your experiment. In our lab, we generally have to recruit participants with extra credit, the promise of snacks, and desperate pleas, so any experiment over an hour or an hour and 15 minutes is unlikely to have many people sign up. If you can pay people they'll be more willing to do a longer experiment, but that means more money you'll have to shell out for each person. Since your experiment is likely to be made up of two or more tasks, such as both discrimination and lexical decision plus a background questionnaire, each task in itself shouldn't be longer than about 25 minutes, if possible. Shorter tasks will also prevent participants' attention from wandering too much, which means more reliable data. A 20-minute AXB or oddity task is already very boring even with a break, and with difficult contrasts it can also be mentally taxing and demoralizing. I know some psychology experiments have participants doing one repetitive task for an hour (how?!), but if you don't want participants to constantly time out on trials because they are falling asleep or trying to surreptitiously check their phones, keep it shorter. Welcome to my blog! I've decided to use this space as a how-to for creating and running perception experiments, both as a way to organize my thoughts and as a way to help you, random person on the internet. I'm writing this for an audience (assuming you exist) that has some knowledge of L2 phonology, but no practical experience running experiments.
So let's get started! First of all, if you're excited to start a perception experiment, as we all should be, you have a research question in mind that you want answered. This research question will determine what kind of task you should use, as different types of tasks examine different levels of processing. In this post I'll outline common types of research questions along with their corresponding appropriate task(s). |
AuthorI like sounds. Here I'll teach you how to play with them and force other people to listen to them. For science. Archives
August 2023
Categories |
 RSS Feed